 Project Controls 360
Planning reliability: is the plan being delivered?
A schedule can be updated every month and still not be delivered. This page measures how much of the planned work actually finishes, and how often forecasts are met.
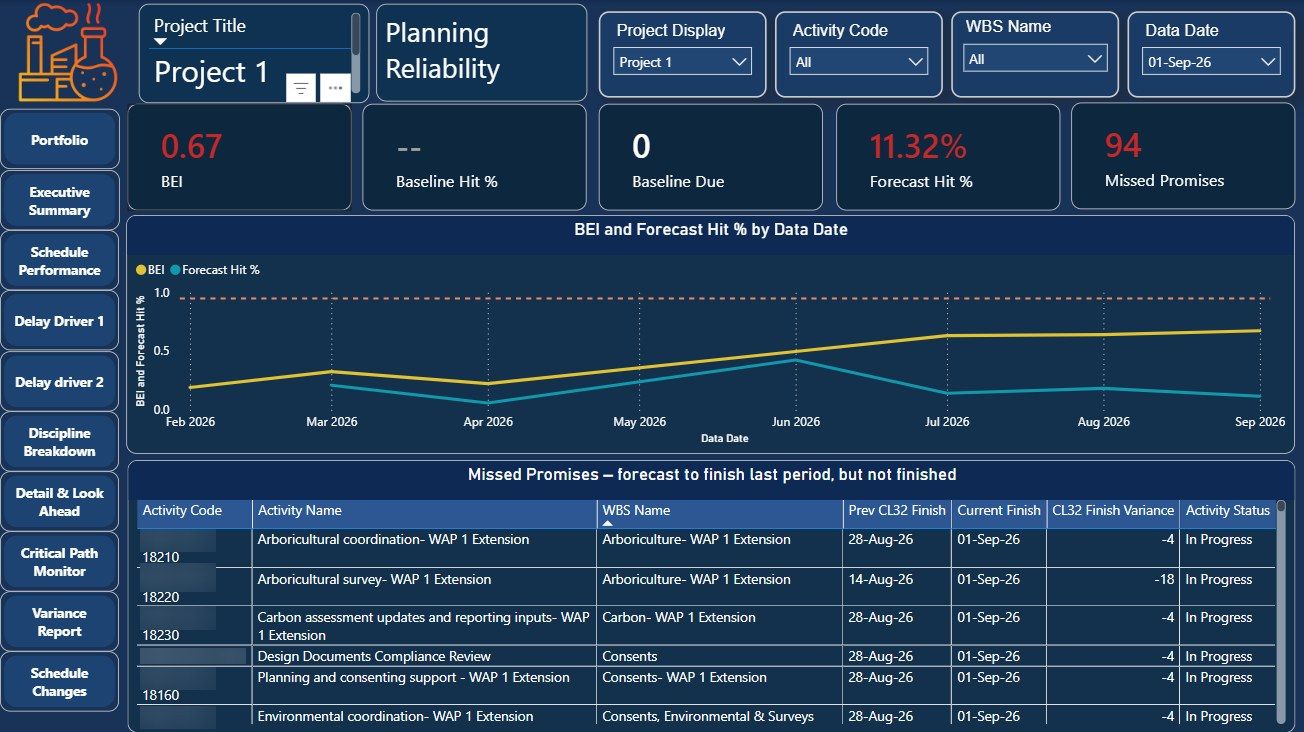
0.67BEI in the example
11%forecast hit rate
94missed promises listed
Every updatetrend over time
The problem
Forecasts that keep moving to the right are a warning sign, but they are hard to see one update at a time. Without a measure, the same optimistic forecast is accepted month after month.
How it works
- Baseline Execution Index. How many of the activities planned to finish by now have actually finished.
- Forecast hit rate. How many activities finished when the previous update said they would.
- Missed promises. The list of activities forecast to finish last period that did not, with their variance.
Walkthrough
Result
Optimistic forecasts are challenged with numbers, and the activities that keep slipping are named.
Project and client identifiers are hidden in the screenshots.